
by Arian Kiandoost, Leiden Learning & Innovation Centre (LLInC), the Netherlands.
At Leiden University, we’re always looking for ways to help students shine, especially in their first year when the transition to university life can be tough. In our latest project, we’ve tackled a big question: can we predict final grades early enough to help students before they fall behind? Focusing on the Academic Literacy course within the International Studies programme, we’ve built a data-driven tool that uses online activity to forecast end-of-semester grades week by week. Here’s how it works, what we found, and why it’s a game-changer for supporting students.

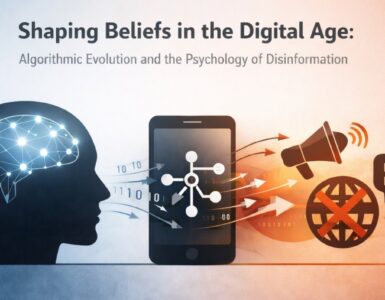
(image credit to Deng Xiang)
The goal: testing predictions in practice
Can simple Brightspace data, such as logins, video views, and quizzes, predict grades well enough for real-world teaching? Research has long shown that this is possible, but our pilot puts it to the test in everyday classrooms. We used data from 469 students in the 2023 Academic Literacy cohort to train and build the tool, and then tested it using data from 458 students in 2024. For privacy, all data was anonymised, and students were given the option to opt out of data processing via email. This pilot is intended as a starting point to spark educators’ discussions about practical uses and ethical concerns when it comes to data privacy.
Diving into the data
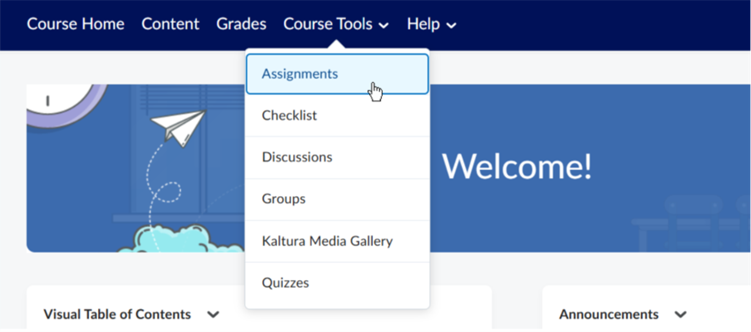
We began with Brightspace logs, capturing every click, view, and submission. We then turned these raw numbers into insights, indicative of the extent of students’ efforts. This was achieved using features including:
· Progress tracking: How many logins, quizzes, or videos has a student done, and how much of their total activity does each of these make up?
· Weekly changes: Are they stepping up or slowing down from last week?
· Consistency: Do they keep a steady routine over a month?
· Class comparison: How does their effort compare to the class average?
· Momentum: How are their activity levels going forward over time?
Building a smart predictor
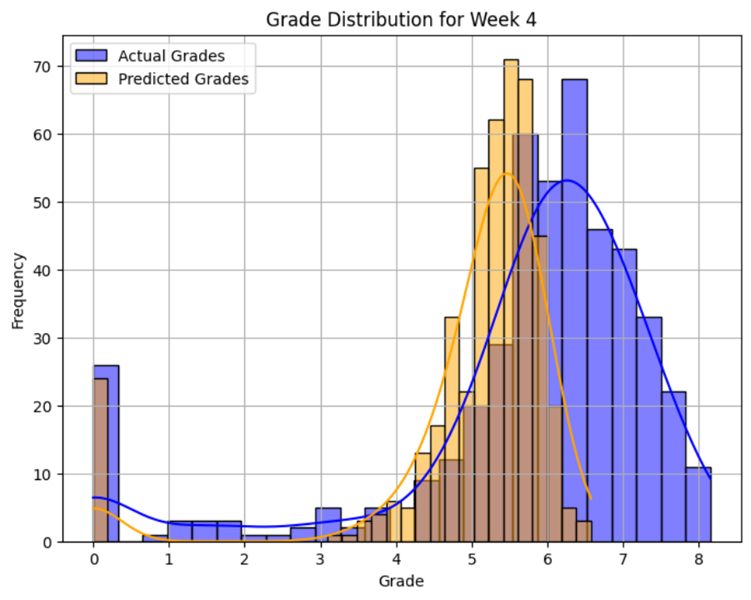
Our tool uses a two-stage model to predict grades. First, it identifies students at risk of receiving a zero (for example, dropouts or no-shows) by detecting patterns across a complex mix of online activities, correctly identifying 95% of these cases. Then, for students engaging with the course, the model predicts their final grade based on many combined signals, such as quiz and video interactions. Compared to randomly guessing the average grade of last year’s cohort for every student in the new cohort, our model is more accurate throughout the semester, particularly around the mid-semester point, correctly predicting grades within one grade point for 62% of students. As expected, the early weeks are less precise due to limited data, but this foundation can be improved with tweaks.
What we learned
Mid-semester, the tool really shines. It flags at-risk students (those trending towards a zero) with enough accuracy for advisors to step in with simple forms of support, such as check-in emails or study tips. It also emphasises patterns of success: consistent quiz-takers and video-watchers often score higher than their less consistent counterparts.
The good news is that predictions are stable for about two-thirds of students, meaning that advisors can rely on the trends for the most part. The predictions are, however, not flawless. Early in the semester, the tool might raise too many alerts, while later on it can sometimes underestimate which student will pull through. These insights emphasise that although the tool has considerable potential to support educators, it should not replace their judgment entirely.
(Image credit to Arian Kiandoost)
Why it matters
This pilot is a starting point, and we can improve it with better data, methods, or factors, including previous grades and performance. More importantly, it opens up a conversation: how can educators use tools like this? Imagine weekly alerts boosting pass rates by tailoring support. We’re also tackling ethics—ensuring GDPR compliance, student consent, and unbiased alerts through collaboration with Leiden University’s data protection team. This balances data’s power with human care, making education adaptive and equitable.
Challenges and next steps
As a pilot — and despite showing great promise — we knew it wouldn’t be perfect. Since we’ve only tested our tool on a single course, we’re now seeking trials in other courses across faculties with similar setups (such as optional tasks and robust Brightspace tracking). Looking ahead, such trials are key, as is our continued commitment to data privacy, compliance, and transparency. Moreover, we’re excited to build advisor dashboards for weekly alerts. Picture receiving a simple email: “Student X’s grade is trending low—suggest a check-in?” In addition, we’re also exploring ways to track long-term impact, helping us establish whether early interventions boost overall student success.
The bigger picture
This project is a step towards a more responsive university experience. By blending data with educator expertise, we can catch struggles early, tailor support, and help more students thrive. It’s not about replacing teachers but giving them a superpower: foresight. As we refine this tool, we invite educators to join us in shaping a future where every student gets the chance to succeed.

Arian Kiandoost is a Data Scientist at Leiden University’s Leiden Learning & Innovation Centre (LLInC), where he applies machine learning and statistical modelling to improve teaching and student outcomes. His work focuses on building predictive models that enable early intervention and support evidence-based decision-making for educators and administrators. With a background in data science from TU Eindhoven, Arian bridges technical precision with practical impact, driving meaningful change in higher education.
*This slightly adapted article was previously published in LLInC’s newsletter.